Additional Themes and Theme Components for ‘ggplot2’ along with additional utility functions for the Center On Rural Innovation.
Overview
The coriplot package is a dedicated visualization toolkit designed specifically for the Center On Rural Innovation. The package extends ggplot2 with customized themes that are in accordance with the CORI Branding Guidelines with the aim of seamless standardization across multiple visuals. Additionally, the package sees added support for a set of utility tools to be used by CORI such as adding thresholds with/without annotations, adding watermarks, and more.
A comprehensive set of examples is available in the Getting Started section of this website.
Installation
You can install the development version of coriplot from GitHub with:
# install.packages("devtools")
devtools::install_github("Dashansh/coriplot")
Example
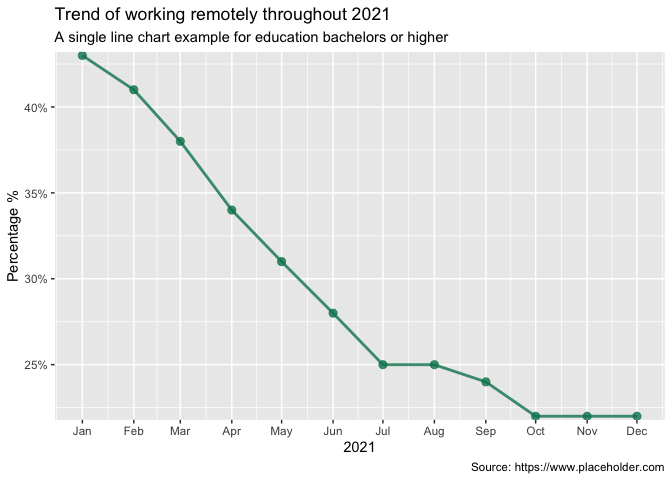
This is a basic example which shows you how to solve a common problem. We plot a single line showing the percentage of remotely working users with education equal to a bachelors degree or higher.
set_cori_geom_defaults()
fig+theme_cori()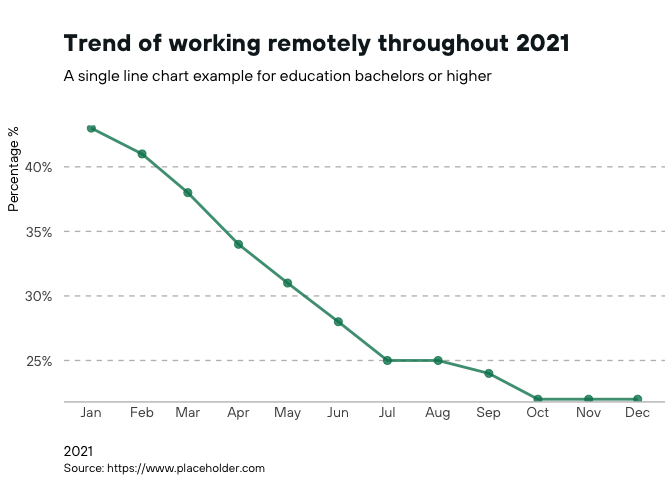
This same graph without the CORI theme to highlight the cori theme customisations.
fig